


| Home |
| Search |
| Today's Posts |
|
#1

|
|||
|
|||
|
Hi all,
I've got Excel 2007 and I'm having some difficulty plotting scatter graphs with two vertical axes. I'd like one axis to be displayed to the left of the data, and one to the right. However, when I choose for the data to be displayed on the secondary axis, Excel puts both axes to the right of the chart, and I cannot find a way to change this. On the odd occasion it puts the axes correctly, I save the file and re-open it to find it has resorted them to both being on the right again. Spending ages on Google hasn't solved my query. A quick screenshot as a picture speaks 1000 words... 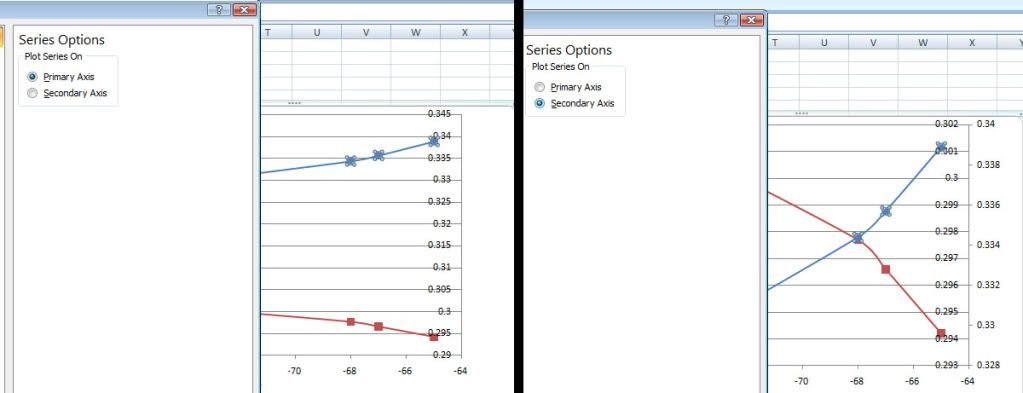 Thanks in advance for any help :) |
| Thread Tools | Search this Thread |
| Display Modes | |
|
|
 Similar Threads
|
||||
| Thread | Forum | |||
| How do I plot an XY (scatter) graph with two Y axes? | Charts and Charting in Excel | |||
| graph column line graph with two axes | Charts and Charting in Excel | |||
| Swap axes on a scatter graph | Charts and Charting in Excel | |||
| Scatter Plot and Axes labels | Charts and Charting in Excel | |||
| Scatter charts -- can I lock in a 1:1 aspect ratio for axes? | Charts and Charting in Excel | |||


 Threaded Mode

