


| Home |
| Search |
| Today's Posts |
|
|
|
#1

Posted to microsoft.public.excel.programming
|
|||
|
|||
|
i'm trying to come up with a formula that will calculate the distance between the peaks and troths in the fluctuations of these currency prices. i've only been studying vba programming for a week so i don't have the know-how to write the algorithm but here is how i imagine it would be done. each wave must be at least 33 pips (a pip is one hundredth of a cent) long. so the wave must extend longer than 33 pips either up or down and a peak or troth is not recorded until the price swings in the opposite direction more than 33 pips. once the last peak and the last troth is known, i want to subtract the two from each other to come up with the length of the wave, as well as the distance it took for the wave to form. let me explain a little bit about my data. each row has four numbers, it represents the opening price, the high price, the low price and the closing price of a five minute block. only the high and low price i think is important for this algorithm. here's how i'm thinking the algorithm would work but i'm not familiar enough with vba syntax to write it. starting point = sp active row high = arh active row low = arl if arh - sp 33 then ar = peak or if arl - sp < -33 then ar = troth if arh peak then arh = newpeak if arl - newpeak < -33 then newpeak = ultimatepeak, subtract ultimatepeak from sp, place value in row where ultimatepeak occurred, also subtract number of blocks between ultimatepeak and starting point, place value in column to the right. if arl < troth then arl = newtroth if arh - newroth 33 then newtroth = ultimatetroth, subtract ultimatetroth from ultimatepeak, place value where ultimatetroth occurred, also subtract number of blocks between ultimatetroth and ultimatepeak, place value in column to the right. if arh peak then arh = newpeak if arl - newpeak < -33 then newpeak = ultimatepeak, subtract ultimatepeak from ultimatetroth, place value where ultimatepeak occurred, also subtract number of blocks between ultimatepeak and ultimatetroth, place value in column to the right. i have provided an example which you can see he http://spreadsheets.google.com/pub?k...3A&output=html the first troth occurs at row 57 at the low price of 1.3985. this is because the starting point is 1.4099 and the price never climbs above the required 33 pips which would be 1.4132 in order for a peak to be registered, but the price does climb below the required 1.4067 in order for a troth to be registered. as the price falls below 1.4067 the first time (i think because i was using a different program that could not register highs and lows only closes) the active cell high is greater than the ultimate troth by 33 pips is at row 57 1.3985. from 1.3985 the price then climbs upwards to 1.4210 at row 102, during that time, the price never fell below the ultimate peak by 33 pips (i think, i might be wrong). we then subtract 1.4210 from 1.3985 and put 225 in the h column (that's the length) and subtract 102 from 57 and get 45, that's the time and put that in column i. however we could not know that 1.4210 would be the ultimate peak until the active row low fell below 1.4177, when that happened that's when we do the calculation. as the price falls below 1.4177, each new low becomes the ulitmate low until the active row high subtracted from that ultimate troth is greater than 33 pips. that happened at row 130, price 1.4081. 1.4081 becomes the ultimate troth as soon as the active row high rises above 33 pips which would be 1.4114. as soon as that happens we subtract 1.4210 from 1.4081 and get -129 and put that in column H. we also subtract 130 from 102 and get 28, that's the time and we put that in column i. the price then rises to 1.4175 and once it falls more than 33 pips from that peak below 1.4142 that's where the data ends for this example. let me also explain why this is important. the market moves in waves. certain wave patterns predict different lengths in future waves. by understanding wave patterns one can have a better sense of where the market is going. |
|
#2
Posted to microsoft.public.excel.programming
|
|||
|
|||
|
Hi Kyle
Woah long post. You will find the longer your posts in this forum the less chance you have of getting traction but I understand after looking at your problem why you went into so much depth. Few things, the first Troph occurs in Row 47. This is when the pips fall below -33 for the first time. Moreover you say: "if arl - newpeak < -33 then newpeak = ultimatepeak" What happens if there has not been a NewPeak when the pips fall below -33. I have assumed you want to detract the ARL from the SP. This would make sense as the SP will be the highest peak to this point. The inverse is also true for the NewTroph, you need a scenario to handle this. Below is my stab at your problem. It assumes your data is in the format presented on the google spreadsheet page. Check the variables for column numbers to make sure yours line up with mine. For example check that ARH is actually in column 4. It keeps are running check on the highs and lows makes note of the cells which are 33 pips higher or lower and ignores all the other cells which fall within these ranges. Two UDFs calculate the peaks and trophs for you. When there is a new high or low a calc is performed to produce a variance from the peaks and trophs. The results appear in Col I and J so if you have addition data in here - lookout! This will be overwritten. I have not addressed the time issue in the code. I have an example spreadsheet which I can send you if you like. Bear in mind it is almost 1am here in Oz so if you have questions I will be in la la land for about 8 hours. This being said there are far more talented souls in this forum, so you will have good company. Take care Marcus Option Explicit Sub HighLow() Dim Res As Long Dim InRow As Long Dim ws As Worksheet Dim EndRow As Long Dim ARH As Long Dim ARL As Long Dim i As Long Dim sp As Double Dim Peak As Double Dim Troph As Double Dim NewPeak As Double Dim NewTroph As Double Set ws = ActiveSheet EndRow = Range("A65536").End(xlUp).Row InRow = 2 'First Row of data ARH = 4 ARL = 5 Res = 9 'Result column With ws sp = .Cells(2, 3).Value For i = InRow To EndRow Peak = .Cells(i, ARH) - sp Troph = .Cells(i, ARL) - sp 'Peak Part If Peak 0.0033 Then .Cells(i, Res) = "Peak" NewPeak = MyMax(Range(Cells(InRow, ARH), Cells(i, ARH))) If .Cells(i, ARH) = NewPeak Then .Cells(i, Res) = "NewPeak" If NewPeak - NewTroph 1 Then 'Handle 0 for NewTroph .Cells(i, Res + 1) = NewPeak - sp Else .Cells(i, Res + 1) = NewPeak - NewTroph End If End If 'Troph Part ElseIf Troph < -0.0033 Then .Cells(i, Res) = "Troph" NewTroph = MyMin(Range(Cells(InRow, ARL), Cells(i, ARL))) If .Cells(i, ARL) <= NewTroph Then .Cells(i, Res) = "NewTroph" If NewTroph - NewPeak 1 Then 'Handle 0 for NewPeak .Cells(i, Res + 1) = NewTroph - sp Else .Cells(i, Res + 1) = NewTroph - NewPeak End If End If Else 'Handle neither .Cells(i, Res) = "" End If Next i End With End Sub Function MyMax(MyRng As Range) MyMax = WorksheetFunction.Max(MyRng) End Function Function MyMin(MyRng As Range) MyMin = WorksheetFunction.Min(MyRng) End Function |
|
#3
Posted to microsoft.public.excel.programming
|
|||
|
|||
|
Marcus, thank you so much for agreeing to help me out. i can't thank you enough. your answer is excellent. however there are still a few problems. i've posted another spreadsheets with the results. the code did not register all of the waves. i don't know why. i've also uploaded a visual chart of what the waves look like, hopefully that might help you visualize it better. again, i can't thank you enough for agreeing to help me. also would it be possible to delete the info after the ultimate peak/trough is established? i have to have those deleted eventually so that i can do a statistical analysis of the lengths of the waves. http://spreadsheets.google.com/ccc?k...JZ0MtMGc&hl=en 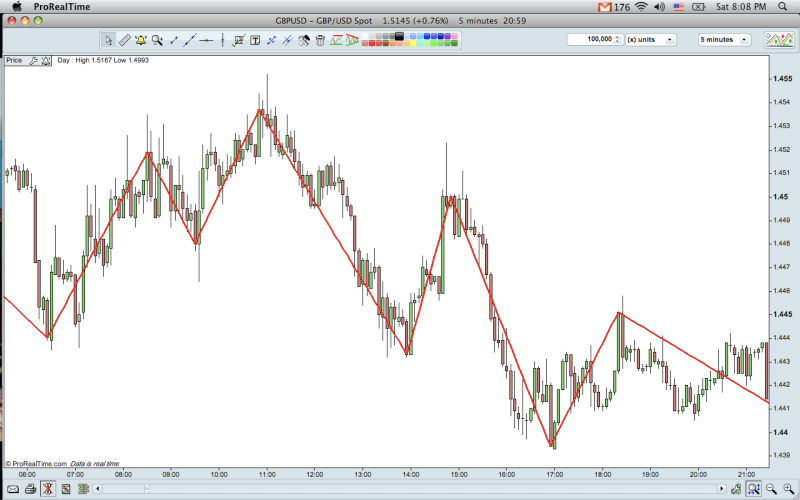 in this visual the software is only able to measure waves by the price's close of a five minute bar, not it's high and low. |
|
#4
Posted to microsoft.public.excel.programming
|
|||
|
|||
|
Hi Kyle
Thanks for the reply. The way I have set this up is if the Peak is greater than 33 points from the starting point SP, then do something. In the examples you have highlighted the pips are not in this 33 point zone so nothing is done. Row 78 has a 27 point spread so nodda happens. Sounds like what you want is every time there is a newtroph this becomes the new SP. Then when the spread is greater than 33 points from NewPeak to newSP then do something. Is this correct? Take care Marcus |
|
#5
Posted to microsoft.public.excel.programming
|
|||
|
|||
|
hi Marcus,
i think i came up with a better way to think of the algroithm if active row high greater than old high then active row becomes new high or if ((new high - active row low) < -.0033) then subtract newhigh from the trough before it. after that if active row low lesser than newtrough then active row becomes newlow or if ((activerowhigh - newlow) .0033) then subtract newlow from the newhigh before it. i hope that helps. just remember we can never know the peak or trough of a wave until the price travels higher or lower than 33 pips. "marcus" wrote: Hi Kyle Thanks for the reply. The way I have set this up is if the Peak is greater than 33 points from the starting point SP, then do something. In the examples you have highlighted the pips are not in this 33 point zone so nothing is done. Row 78 has a 27 point spread so nodda happens. Sounds like what you want is every time there is a newtroph this becomes the new SP. Then when the spread is greater than 33 points from NewPeak to newSP then do something. Is this correct? Take care Marcus . |
|
#6
Posted to microsoft.public.excel.programming
|
|||
|
|||
|
here's something else. with each new row we are making two tests if we are
going up we are testing, one, to see if there is a new high, and two, to see if the new low is lesser than 33 pips subtracted from the ultimate high. |
|
#7
Posted to microsoft.public.excel.programming
|
|||
|
|||
|
Hi Kyle
Hopefully we are getting closer. This part "if active row high greater than old high then active row becomes new high " has always been true the model does this. The second part now or if ((new high - active row low) < -.0033) then subtract newhigh from the trough before it. Do you mean subtract the newhigh from the newtrough. This will cause odd results so I put The Active Row high less the NewTrough. This is the line you will want to play with CatchP = .Cells(i, ARH) - NewTrough CatchT = .Cells(i, ARL) - NewPeak These two lines control the second part of the equation. Let me know what these should be if this version of the algorithm is not getting the job done. If you change this to CatchP = NewPeak - NewTrough CatchT =NewTrough - NewPeak You will see the results look very wrong. Let me know how this next stab goes. Take care Marcus Full code below. Option Explicit Sub HighLow() Dim Res As Long Dim InRow As Long Dim ws As Worksheet Dim EndRow As Long Dim ARH As Long Dim ARL As Long Dim i As Long Dim sp As Double Dim Peak As Double Dim Trough As Double Dim NewPeak As Double Dim NewTrough As Double Dim CatchP As Double Dim CatchT As Double Set ws = ActiveSheet EndRow = Range("A65536").End(xlUp).Row InRow = 2 'First Row of data ARH = 4 ARL = 5 Res = 9 'Result column With ws sp = .Cells(2, 3).Value For i = InRow To EndRow 'if ((new high - active row low) < -.0033) then subtract newhigh from the trough before it. Peak = .Cells(i, ARH) - sp Trough = .Cells(i, ARL) - sp CatchP = .Cells(i, ARH) - NewTrough CatchT = .Cells(i, ARL) - NewPeak 'Peak Part If Peak 0.0033 Or CatchP 0.0033 And CatchP < 1 Then .Cells(i, Res) = "Peak" NewPeak = MyMax(Range(Cells(InRow, ARH), Cells(i, ARH))) If .Cells(i, ARH) = NewPeak Then .Cells(i, Res) = "NewPeak" If NewPeak - NewTrough 1 Then 'Handle 0 for NewTrough .Cells(i, Res + 1) = NewPeak - sp Else .Cells(i, Res + 1) = NewPeak - NewTrough End If End If ' Trough Part ElseIf Trough < -0.0033 Or CatchT < -0.0033 And CatchT < 1 Then .Cells(i, Res) = "Trough" NewTrough = MyMin(Range(Cells(InRow, ARL), Cells(i, ARL))) If .Cells(i, ARL) <= NewTrough Then .Cells(i, Res) = "NewTrough" If NewTrough - NewPeak 1 Then 'Handle 0 for NewPeak .Cells(i, Res + 1) = NewTrough - sp Else .Cells(i, Res + 1) = NewTrough - NewPeak End If ' sp = NewTrough End If Else 'Handle neither .Cells(i, Res) = "" End If Next i End With End Sub Function MyMax(MyRng As Range) MyMax = WorksheetFunction.Max(MyRng) End Function Function MyMin(MyRng As Range) MyMin = WorksheetFunction.Min(MyRng) End Function |
| Reply |
| Thread Tools | Search this Thread |
| Display Modes | |
|
|
 Similar Threads
|
||||
| Thread | Forum | |||
| Does Microsoft disseminate their market penetration to the market? | Excel Discussion (Misc queries) | |||
| Measuring Accuracy | Excel Discussion (Misc queries) | |||
| Measuring Average Changes | Excel Discussion (Misc queries) | |||
| How to calculate market growth and market share? | Excel Programming | |||
| period of sum of sine waves | Excel Programming | |||


 Hybrid Mode


