Marcus,
thank you so much for agreeing to help me out. i can't thank you enough.
your answer is excellent. however there are still a few problems. i've
posted another spreadsheets with the results. the code did not register all
of the waves. i don't know why. i've also uploaded a visual chart of what
the waves look like, hopefully that might help you visualize it better.
again, i can't thank you enough for agreeing to help me.
also would it be possible to delete the info after the ultimate peak/trough
is established? i have to have those deleted eventually so that i can do a
statistical analysis of the lengths of the waves.
http://spreadsheets.google.com/ccc?k...JZ0MtMGc&hl=en
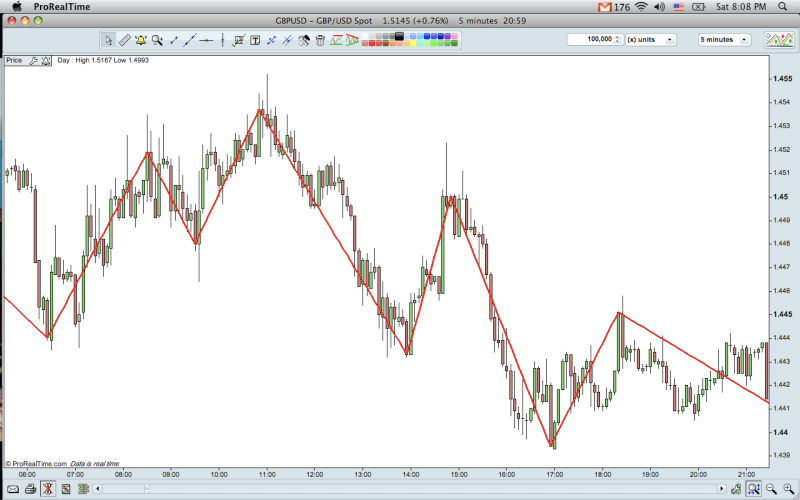
in this visual the software is only able to measure waves by the price's
close of a five minute bar, not it's high and low.