


| Home |
| Search |
| Today's Posts |
|
#1

Posted to microsoft.public.excel.misc
|
|||
|
|||
|
i'm making a chart with 3 columns of data. in one column every cell is
filled. there are about 400 cells. in the next column not every cell is filled, maybe about 20, same as the third column. when i make a chart i cannot get a line to connet the data in column two and three. worse, i cannot get a trendline to apply. i'm trying to get a 5 period moving average or so for column two and three and i can't. here's a picture so that you know what i'm talking about. http://i87.photobucket.com/albums/k1...Picture2-2.png 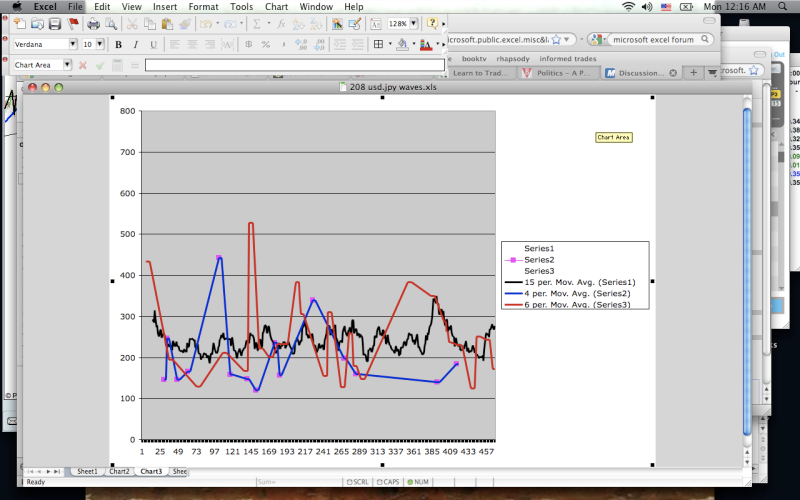 |
| Thread Tools | Search this Thread |
| Display Modes | |
|
|
 Similar Threads
|
||||
| Thread | Forum | |||
| Connect bars in a column chart | Charts and Charting in Excel | |||
| bar chart prints 1 unwanted horizontal row of dots & tick marks? | Charts and Charting in Excel | |||
| Leading dots...trailing dots | Excel Discussion (Misc queries) | |||
| connecting dots on a chart | Excel Discussion (Misc queries) | |||
| generat a chart of dots with different colors | Charts and Charting in Excel | |||


 Threaded Mode

