
|
cannot connect the dots in chart
i'm making a chart with 3 columns of data. in one column every cell is
filled. there are about 400 cells. in the next column not every cell is filled, maybe about 20, same as the third column. when i make a chart i cannot get a line to connet the data in column two and three. worse, i cannot get a trendline to apply. i'm trying to get a 5 period moving average or so for column two and three and i can't. here's a picture so that you know what i'm talking about. http://i87.photobucket.com/albums/k1...Picture2-2.png 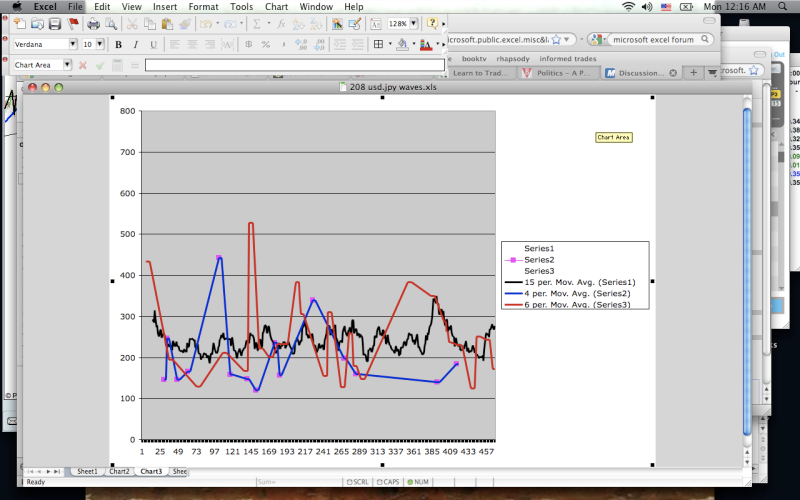 |
cannot connect the dots in chart
Will this be for any help ?
http://office.microsoft.com/en-us/he...485551033.aspx Micky "kyle" wrote: i'm making a chart with 3 columns of data. in one column every cell is filled. there are about 400 cells. in the next column not every cell is filled, maybe about 20, same as the third column. when i make a chart i cannot get a line to connet the data in column two and three. worse, i cannot get a trendline to apply. i'm trying to get a 5 period moving average or so for column two and three and i can't. here's a picture so that you know what i'm talking about. http://i87.photobucket.com/albums/k1...Picture2-2.png |
| All times are GMT +1. The time now is 08:26 AM. |
Powered by vBulletin® Copyright ©2000 - 2025, Jelsoft Enterprises Ltd.
ExcelBanter.com