


| Home |
| Search |
| Today's Posts |
|
#1

|
|||
|
|||
|
One method of doing stock analysis has to do with identifying a trendline. The trendline needs to be a straight line that crosses three or more points of the low stock price. (see example below). Can anyone think of a way of doing this in Excel? The trendline that exists within Excel is a based on a regression so it's not straight.
Thanks for looking. - Paul 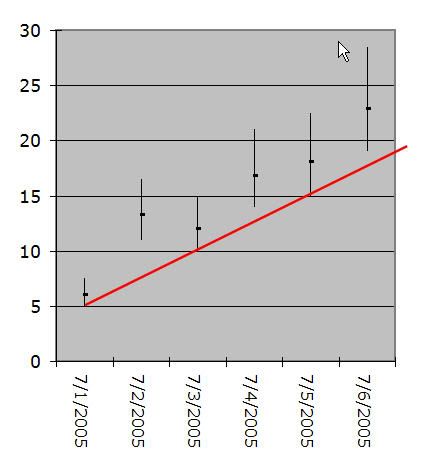 Here's the data I used to create the graph above (I drew the red line) High Low Close 1-Jul 7.5 5 6 2-Jul 16.5 11 13.2 3-Jul 15 10 12 4-Jul 21 14 16.8 5-Jul 22.5 15 18 6-Jul 28.5 19 22.8 |
|
#2
|
|||
|
|||
|
Anyone have any ideas? Is it not possible? thanks
|
|
#3
|
|||
|
|||
|
I added a series to the chart using an extra column:
High Low Close Low' 1-Jul 7.5 5 6 5 2-Jul 16.5 11 13.2 3-Jul 15 10 12 10 4-Jul 21 14 16.8 5-Jul 22.5 15 18 15 6-Jul 28.5 19 22.8 I had manually deleted the points the trendline doesn't pass through. Since the values were already in the chart, I didn't have to use any special techniques to avoid messing up the high low lines (my normal stock charts don't use Excel's stock chart type, but error bars and such). Then I added a trendline to this incomplete data series. Somebody smart could probably develop an algorithm to progarmmatically determine the points to use in the trendline. - Jon ------- Jon Peltier, Microsoft Excel MVP Peltier Technical Services Tutorials and Custom Solutions http://PeltierTech.com/ _______ pwinter wrote: One method of doing stock analysis has to do with identifying a trendline. The trendline needs to be a straight line that crosses three or more points of the low stock price. (see example below). Can anyone think of a way of doing this in Excel? The trendline that exists within Excel is a based on a regression so it's not straight. Thanks for looking. - Paul [image: http://i20.photobucket.com/albums/b2...l_Example.jpg] Here's the data I used to create the graph above (I drew the red line) High Low Close 1-Jul 7.5 5 6 2-Jul 16.5 11 13.2 3-Jul 15 10 12 4-Jul 21 14 16.8 5-Jul 22.5 15 18 6-Jul 28.5 19 22.8 |
| Reply |
| Thread Tools | Search this Thread |
| Display Modes | |
|
|
 Similar Threads
|
||||
| Thread | Forum | |||
| Removing rows that don't show the lowest stock each day | Excel Discussion (Misc queries) | |||
| Stock Location Sorting Problem | Excel Discussion (Misc queries) | |||
| Trendline Extract | Charts and Charting in Excel | |||
| How do I get the trendline equation from Excel to script? | Charts and Charting in Excel | |||
| I need a template for stock | Excel Worksheet Functions | |||


 Linear Mode


