One method of doing stock analysis has to do with identifying a trendline. The trendline needs to be a straight line that crosses three or more points of the low stock price. (see example below). Can anyone think of a way of doing this in Excel? The trendline that exists within Excel is a based on a regression so it's not straight.
Thanks for looking. - Paul
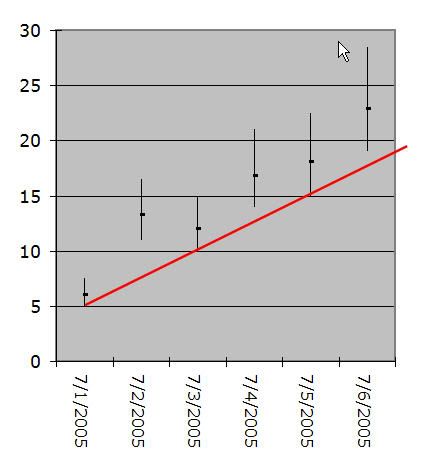
Here's the data I used to create the graph above (I drew the red line)
High Low Close
1-Jul 7.5 5 6
2-Jul 16.5 11 13.2
3-Jul 15 10 12
4-Jul 21 14 16.8
5-Jul 22.5 15 18
6-Jul 28.5 19 22.8